
Transform Concepts into Visual Knowledge
Graph Knowledge GPT is your gateway to understanding complex concepts through the power of visual knowledge graphs. Just enter an idea and let our AI-powered service create a detailed knowledge graph that illuminates the connections, relationships, and structures hidden within. Ready to explore? Let's dive in.
How It Works
- Enter Your Concept: Use our intuitive interface to type any concept, topic, or idea. From intricate scientific theories to complex historical timelines, our Graph GPT is equipped to handle various subjects.
- AI-Powered Analysis: Our advanced Graph GPT AI analyzes your input, extracting key elements, relationships, and data points to construct a comprehensive knowledge graph.
- Receive Your Knowledge Graph: Within moments, a detailed and interactive knowledge graph is generated. We'll email it directly to you, ready for exploration, learning, and sharing.
Explore a World of Concepts
Graph Knowledge GPT brings subjects to life through visual data. Here are just a few examples of what you can discover:
- Biology and Life Sciences: Unravel the web of life, from the genetic level to entire ecosystems.
- Medicine and Healthcare: Decode the complexities of medical knowledge, from symptoms to treatment pathways.
- Computer Science and IT: Navigate the landscape of algorithms, programming languages, and network architectures.
- Environmental Science and Ecology: Visualize the interplay between species, habitats, and climate change.
- Sociology and Political Science: Understand the networks of social relationships, political structures, and policy impacts.
- Business and Economics: Connect economic theories, market trends, and business strategies.
- History and Cultural Studies: Trace the flow of historical events, cultural movements, and influential figures.
- Education and Learning Sciences: Map out educational concepts, learning theories, and knowledge structures.
Why Use Graph Knowledge GPT?
- Enhance Understanding: Visual representations help clarify complex information, making learning more intuitive.
- Save Time: Quickly grasp the essence of a concept without sifting through dense text or multiple sources.
- Tailored to You: Receive customized knowledge graphs based on your interests and queries.
Get Started
Embark on your journey to deeper understanding today. Enter your concept, and watch as Graph Knowledge GPT unveils the connections and patterns that define our world.
Medicine and Healthcare
- Data Example: Explore the differential diagnosis of chest pain, mapping out potential causes such as heart attack, acid reflux, pulmonary embolism, and costochondritis. Include relationships with symptoms, diagnostic tests (like ECG, chest X-ray, blood tests), and treatment options for each cause.

Biology and Life Sciences
- Data Example: Visualize the genetic relationships between species in an ecosystem, such as a rainforest. Show links between plants, animals, and insects, highlighting symbiotic relationships, predator-prey dynamics, and energy flow through photosynthesis and food consumption.

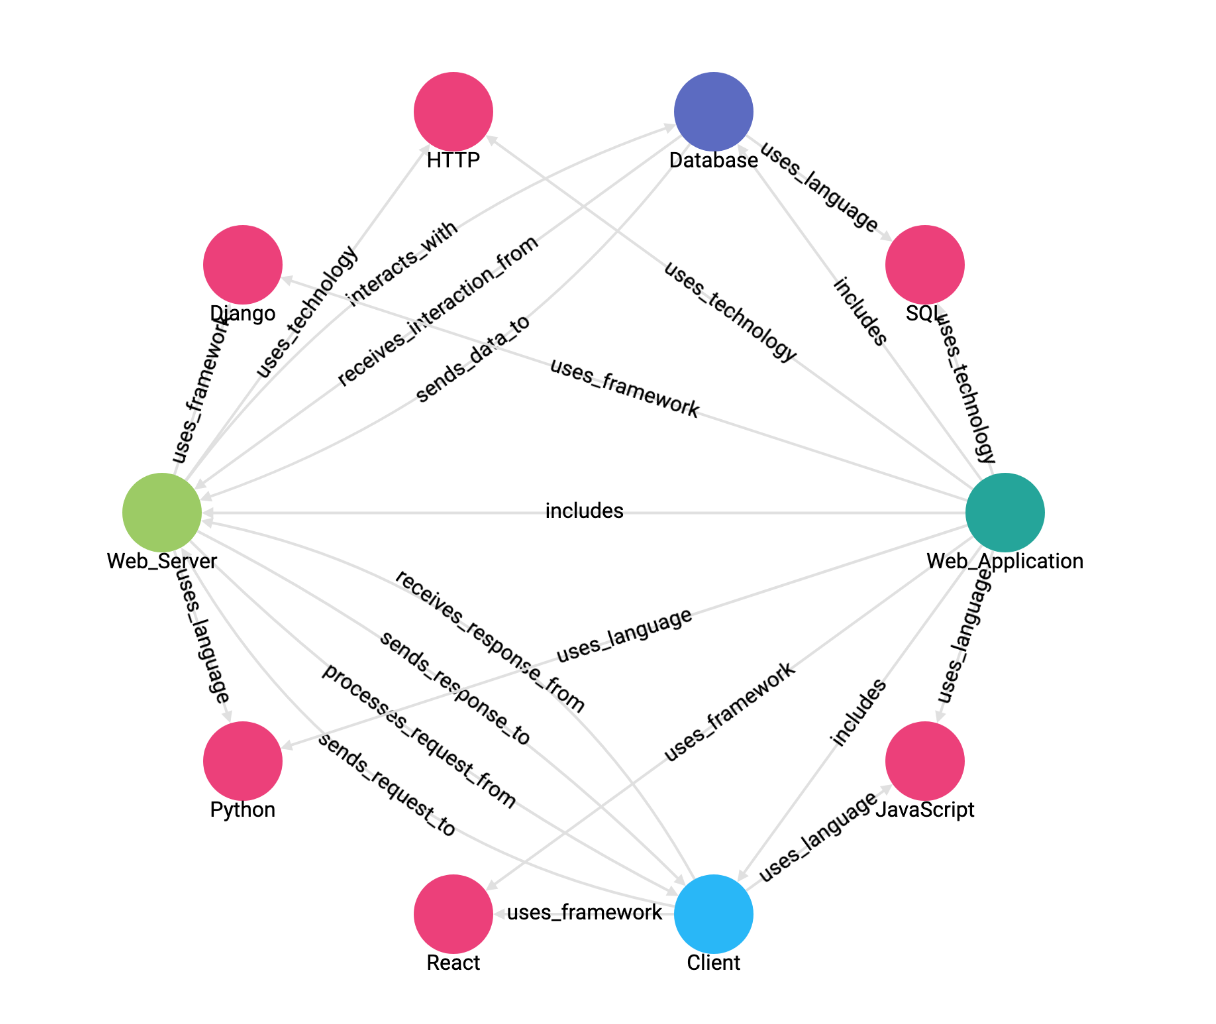
Computer Science and IT
- Data Example: Illustrate the structure of a simple web application, showing how client requests flow through a web server, interact with a database, and return to the client. Include nodes for different programming languages (e.g., JavaScript, Python), frameworks (e.g., React, Django), and technologies (e.g., HTTP, SQL).
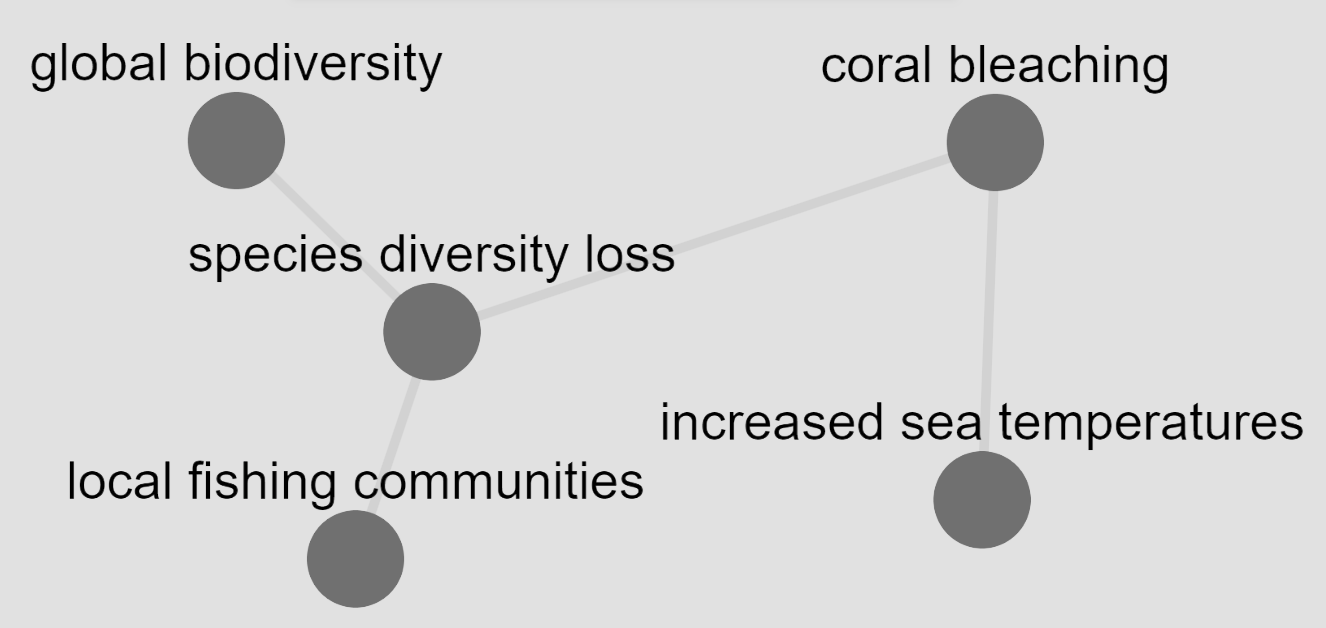
Environmental Science and Ecology
- Data Example: Map the impact of climate change on coral reef ecosystems, detailing the relationships between increased sea temperatures, coral bleaching, species diversity loss, and the effects on local fishing communities and global biodiversity.
Sociology and Political Science
- Data Example: Create a graph showing the influence of social media networks on political opinions, highlighting the flow of information, key influencers, echo chambers, and the impact on voter behavior during an election cycle.
GRAPH GPT PICTURE HERE
Business and Economics
- Data Example: Depict the global supply chain of a smartphone, from raw material extraction (e.g., minerals for batteries) through manufacturing (e.g., assembly in different countries) to the end consumer, including the economic relationships between suppliers, manufacturers, and markets.
GRAPH GPT PICTURE HERE
History and Cultural Studies
- Data Example: Trace the major events of the Renaissance, connecting influential figures (e.g., Leonardo da Vinci, Michelangelo), key inventions (e.g., the printing press), and significant works of art and literature to show the exchange of ideas and its impact on European culture.
GRAPH GPT PICTURE HERE
Education and Learning Sciences
- Data Example: Diagram the cognitive development theories of Piaget, including stages from sensorimotor to formal operational. Show how each stage leads to new logical thinking, abstract reasoning, and problem-solving abilities, linking to educational strategies that support development at each stage.
GRAPH GPT PICTURE HERE
Contact Us
Got questions? Interested in more examples or specialized applications? Reach out to us! We're here to help you unlock the full potential of visual knowledge.
Expanding Horizons: Diverse Applications of Knowledge Graphs
Knowledge Graphs are not just tools for visualization; they are gateways to understanding complex relationships and dynamics across numerous domains. Our platform leverages this powerful technology to bring you a suite of applications tailored to meet the needs of various sectors. Discover how Knowledge Graphs can transform data into actionable insights.
Personalized Learning and Development
Customize your educational and professional journey with precision. Our Knowledge Graphs analyze your skills, identify gaps, and align with your career aspirations to recommend a personalized learning path. This adaptive approach ensures that every learner or professional stays ahead in their field with tailored resources and activities.
Healthcare and Patient Care Management
Transform patient data into personalized care plans. By integrating clinical research and treatment protocols, our Knowledge Graphs offer a comprehensive view of patient health, aiding in diagnosing and recommending treatments. This holistic approach ensures that healthcare providers can make informed decisions, enhancing patient care quality.
Financial Services and Risk Management
Navigate the complexities of the financial world with ease. Our Knowledge Graphs provide a dynamic visualization of the relationships between financial products, market conditions, and client portfolios, helping you assess risks and uncover investment opportunities with unparalleled clarity.
Supply Chain and Logistics Optimization
Optimize your supply chain with strategic insights. From mapping out the intricate web of suppliers and manufacturers to predicting potential bottlenecks and shortages, our Knowledge Graphs facilitate efficient logistics planning, ensuring smooth operations and sustainability in your supply chain.
Research and Development
Accelerate innovation by connecting the dots between research findings, patents, and existing technologies. Our Knowledge Graphs help identify new relationships and knowledge gaps, guiding your research and development efforts towards groundbreaking discoveries.
Content Recommendation Systems
Enhance your content discovery experience with personalized recommendations. By analyzing your preferences and patterns, our Knowledge Graphs curate a selection of books, movies, music, and articles that match your unique tastes, ensuring every recommendation is as unique as you are.
Environmental Monitoring and Sustainability
Make informed decisions for a sustainable future. Our Knowledge Graphs track the interplay between environmental factors, species, and human activities, offering insights into ecosystem health and guiding conservation efforts.
Urban Planning and Smart Cities
Shape the cities of tomorrow with data-driven planning. Integrating traffic patterns, public services, and demographic trends, our Knowledge Graphs provide a comprehensive view of urban dynamics, aiding in developing smarter, more livable cities.
Social Network Analysis
Uncover the dynamics of social networks with detailed analyses of information spread, influence patterns, and community structures. Our Knowledge Graphs reveal key influencers and social clusters, providing valuable insights for marketing, research, and social initiatives.
Crisis Management and Response
Coordinate emergency responses with efficiency. In times of crisis, our Knowledge Graphs map the critical relationships between affected areas, resources, and response teams, prioritizing actions to mitigate impact and aid recovery.
Cultural Heritage and Preservation
Celebrate and preserve the legacy of human civilization. By documenting the connections between historical artifacts, cultural sites, and intangible heritage, our Knowledge Graphs create interactive experiences that bring cultural narratives to life.
Entertainment and Media Production
Craft compelling narratives with consistency and depth. Our Knowledge Graphs assist in the creation of films, games, and literature by tracking characters, plots, and settings, ensuring a cohesive and engaging storytelling experience.